
Photographs by courtesy of Seoul Museum of Art
Sasa[44] Annual Report 2006–2019
- 2020
- adhesive plastic film
- Dimensions variable
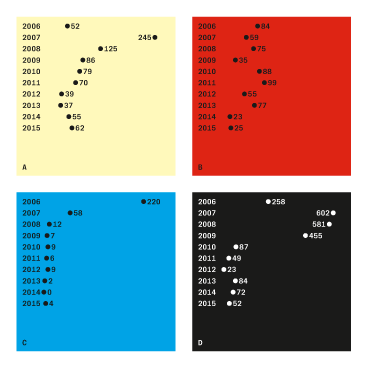
This edition of Sasa[44] Annual Report, created for the artist’s exhibition for children, presents fourteen years’ worth of data in the large-scale mural. The charts are designed following the Isotype principles (repeating unit symbols instead of distorting shapes to express quantity, for example).
- Project type:
- ambiguous
- Typefaces:
- Septima
- Soft Ggothicssi
- Commissioners:
- Sasa[44]
- Seoul Museum of Art
- Yoo Hanna


![Sasa[44] Annual Report 2013 Sasa[44] Annual Report 2013](http://www.sulki-min.com/wp/wp-content/uploads/2014/08/Sasa_Annual_Report_2013_1.png)
![Sasa[44] Annual Report 2012 Sasa[44] Annual Report 2012](http://www.sulki-min.com/wp/wp-content/uploads/2013/06/Sasa_Annual_Report_2012_thumb.jpg)
![Sasa[44] Annual Report 2011](http://www.sulki-min.com/wp/wp-content/uploads/2012/10/Sasa_Annual_Report_2011-thumb.jpg)
![Sasa[44] Annual Report 2010, front cover](http://www.sulki-min.com/wp/wp-content/uploads/2011/12/Sasa_Annual_Report_2010_cover.jpg)
![Sasa[44] Annual Report 2009](http://www.sulki-min.com/wp/wp-content/uploads/2010/04/AnnualReport2009_print-thumb.jpg)
![Sasa[44] Annual Report 2008](http://www.sulki-min.com/wp/wp-content/uploads/2009/04/Sasa_Annual_Report_2008_thumb.jpg)
![Sasa[44] Annual Report 2007](http://www.sulki-min.com/wp/wp-content/uploads/2008/03/Sasa_Annual_Report_2007-1.jpg)
![Sasa[44] Annual Report 2006](http://www.sulki-min.com/wp/wp-content/uploads/2007/04/Sasa_AR2006_1.png)